
Case study: Logistics and Supply Chain
How a Logistics Group in the World Wide Alliance Built Audit-Ready, Customer-Level Emissions Data
A leading logistics group, backed by a US investor and a member of the World Wide Alliance, a worldwide network of independent freight consolidators, needed emissions data that would stand up to its investors, its auditors and its customers. Customers wanted to know the emissions from their own shipments, and the group's data lived in manual spreadsheets spread across locations and group companies.
On GovEVA, it built an audit-ready greenhouse gas emissions baseline and can now report emissions for each customer. Freight emissions across ocean, air, road and rail flow in automatically, Scope 1, 2 and 3 emissions are tracked on one platform, and manual effort in emissions data management is down by about 60%.
Basecamp: The Challenge
Investor-grade disclosure expectations, spreadsheet-grade data
The company runs freight forwarding, warehousing, transportation and distribution through several group companies. As a World Wide Alliance member serving customers across global trade lanes, and with a US investor among its shareholders, it faced growing pressure for transparent, reliable sustainability disclosures. It also wanted a firm baseline for a future decarbonization plan. Its data was not ready for either.
Where do our emissions actually come from?
The question every audit, investor review and decarbonization plan starts with, and one spreadsheets could not answer reliably.
Customers asking for their share
Customers needed the emissions from their own shipments for their own value chain reporting, and spreadsheets could not split emissions by customer.
Manual, scattered spreadsheets
Environmental data was kept by hand in spreadsheets across locations and business units, which led to inconsistencies, reporting delays and no single source of truth.
No clear view of emissions
There was limited insight into how much came from fuel, electricity or freight activity, and tracking Scope 1, 2 and 3 emissions over time was difficult.
No audit trail
Without a central system, there was no audit-ready record of documents, versions and calculations.
Ascent: The Solution
One platform for every emissions source, from the warehouse to the freight lane
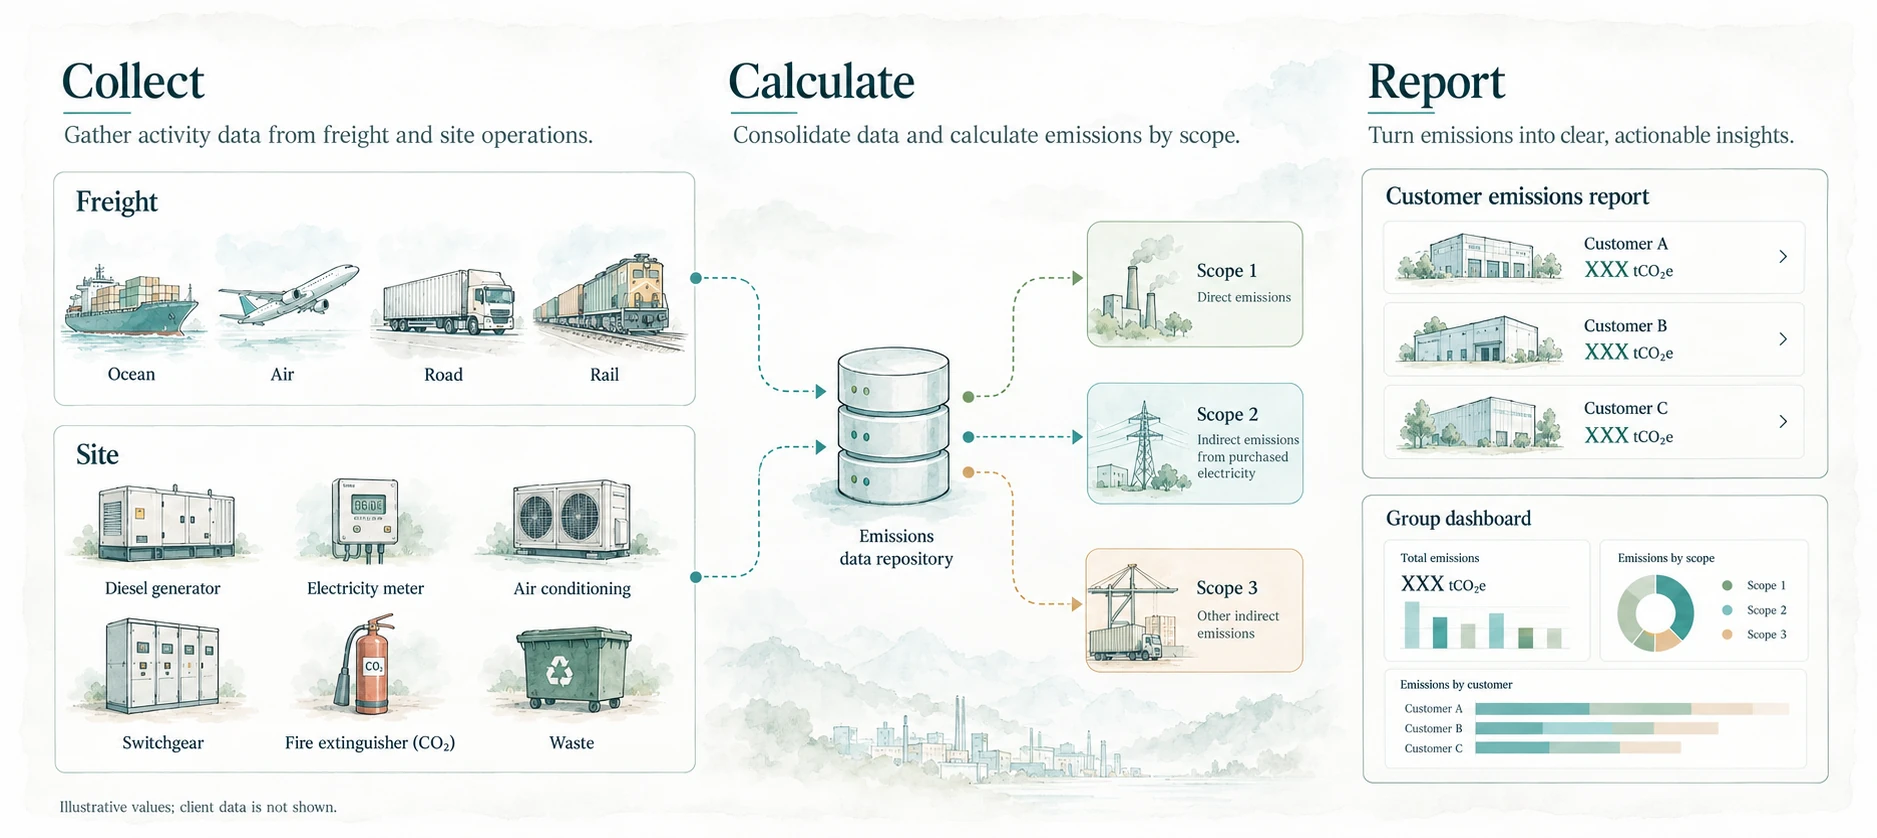
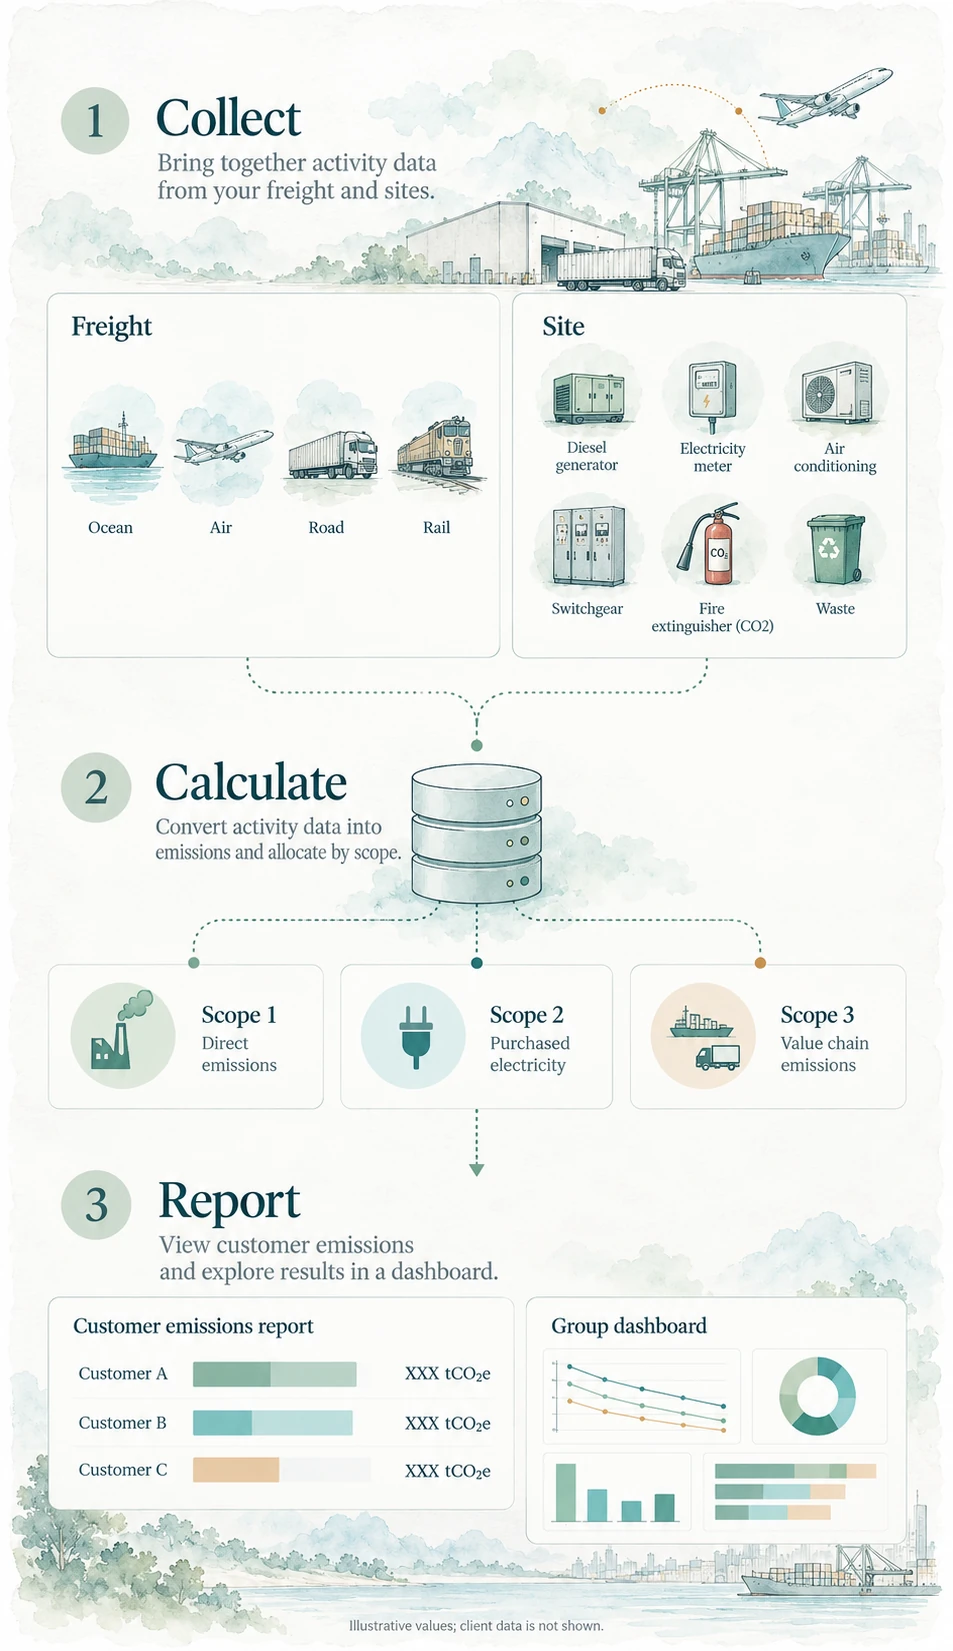
GovEVA configured its sustainability platform in line with the Greenhouse Gas (GHG) Protocol, the global standard for corporate emissions accounting, and rolled it out location by location. It works in three steps: collect data in one place, calculate emissions with protocol-aligned methods, and report them to management and stakeholders.
Collect
Every location, one repository.
Freight data, connected
Integrations pull in data for ocean, air, road and rail freight, so freight emissions are calculated without manual entry.
A central data repository
Spreadsheets were replaced by one digital repository covering every operating location, with access set by role.
Phased rollout
Customized greenhouse gas toolkits were activated one location at a time across the company's three sites in India.
Calculate
Built on the GHG Protocol.
All three scopes
Direct emissions, emissions from purchased energy and value chain emissions (Scope 1, 2 and 3) are calculated on the platform and categorized as the GHG Protocol requires.
Custom calculators
GovEVA built dedicated workflows for waste, food waste, and gas leaks from air conditioning (HVAC) systems, electrical circuit breakers and fire extinguishers.
Emissions for each customer
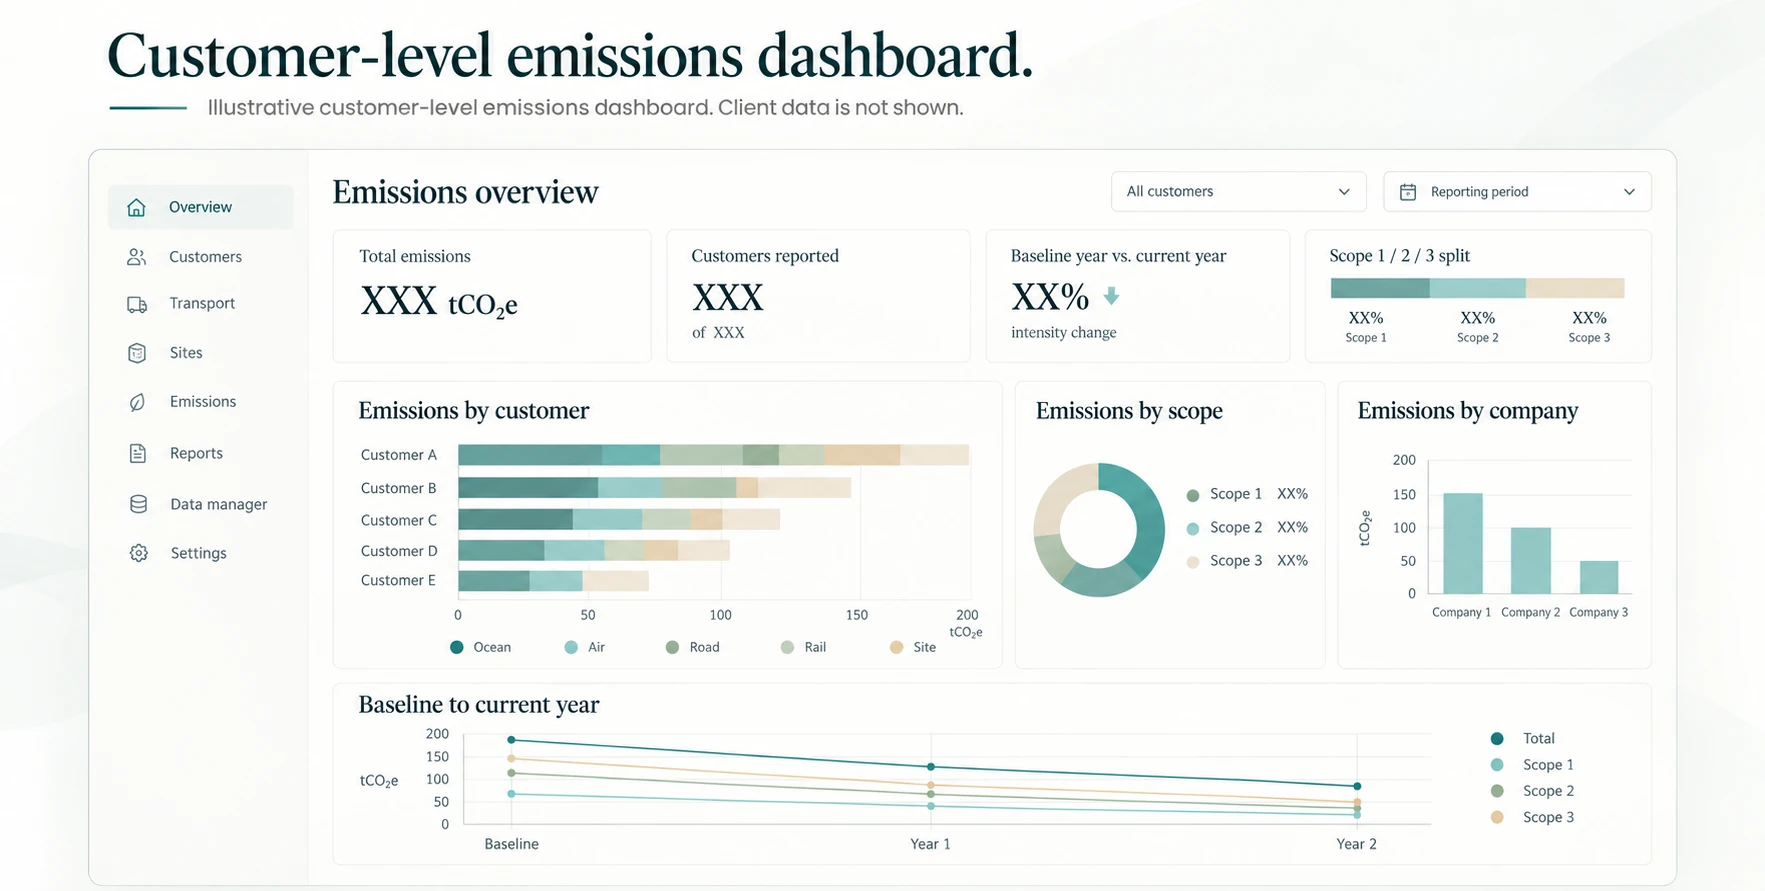
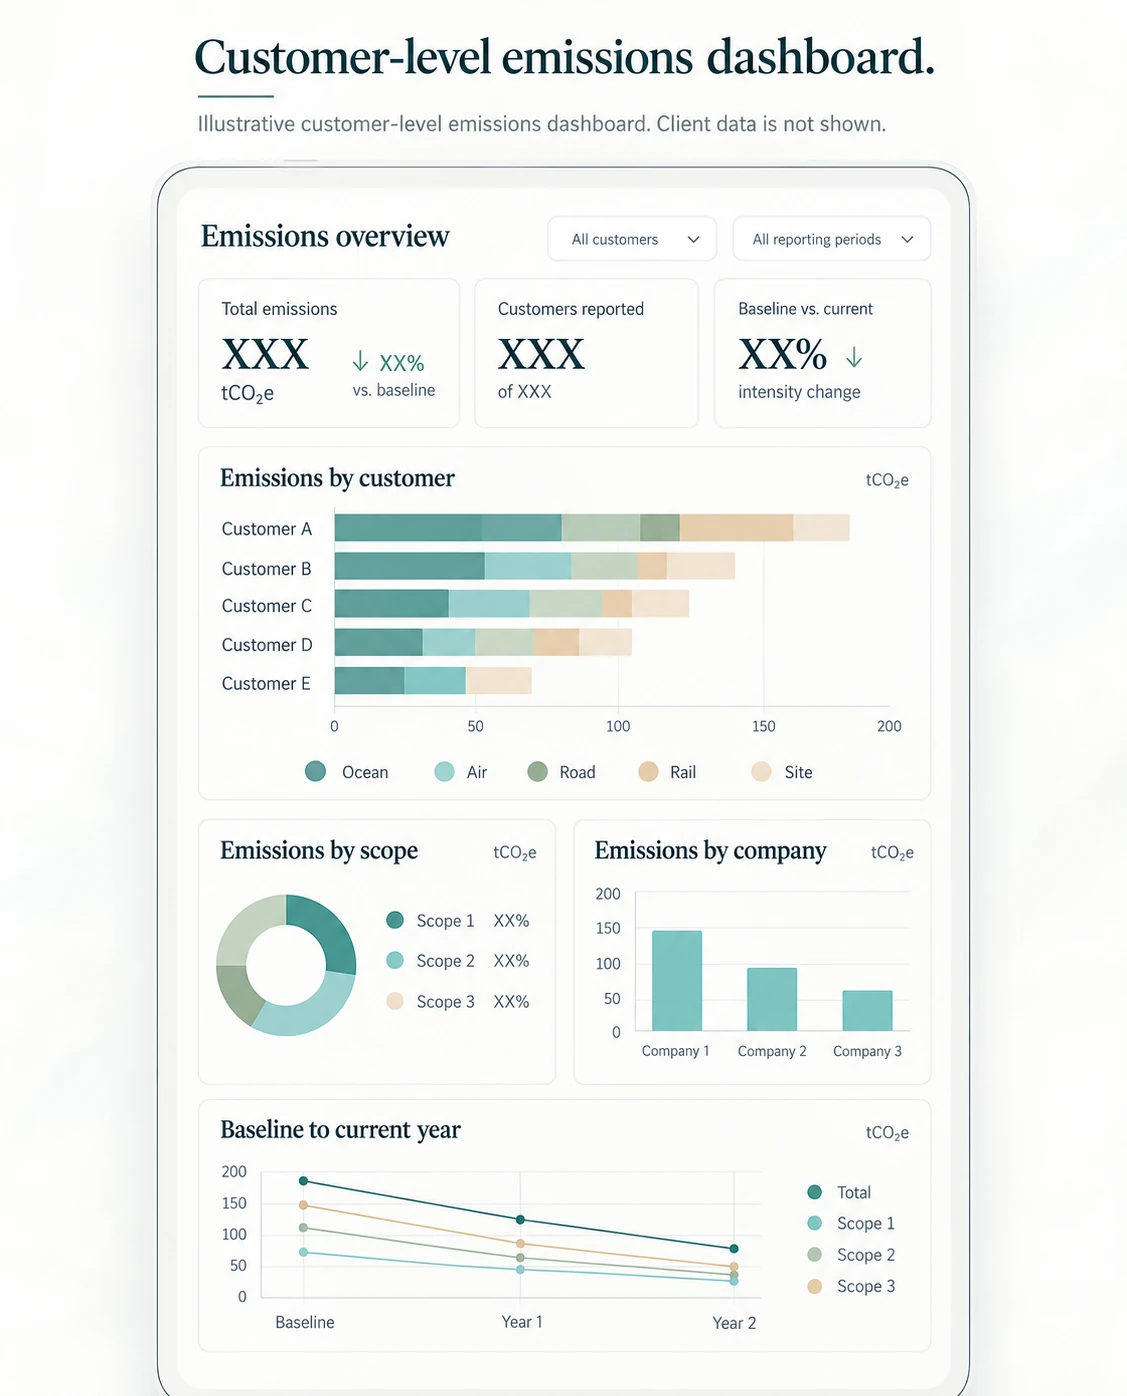
Freight emissions are allocated to each customer across ocean, air, road and rail, using emission factors applied consistently across every location.
Report
A view for every level of the business.
Group dashboards
Custom dashboards and analytics give senior management a scope-by-scope view across the group, with views for each group company.
Customer emissions reports
Emissions can be reported for individual customers, ready for them to use in their own sustainability reporting.
Review meetings
Dashboards are used in sustainability review meetings to track performance across the group.
Advisory and training. GovEVA advised on building the company's greenhouse gas inventory and worked closely with its sustainability and operations teams on onboarding and data mapping.
Summit: The Outcomes
An audit-ready baseline to build a decarbonization plan on
- An audit-ready emissions baseline gives the company the foundation it needed for a formal decarbonization plan.
- With customer-level emissions data, the company can now answer customer requests for the emissions from their shipments, which customers need for their own Scope 3 reporting.
- Sustainability reporting for investors, customers and other stakeholders now draws on one consistent, documented data set.
- Manual effort in emissions data management is down by about 60%, with shorter sustainability reporting timelines.
- Management has clear, scope-by-scope visibility of Scope 1, 2 and 3 emissions across the group.
- Automated freight emissions data from ocean, air, road and rail now flows into one central repository covering every operating location.
- Gas leaks from HVAC systems, circuit breakers and fire extinguishers are now part of the greenhouse gas inventory, calculated consistently across locations.
Why an audit-ready baseline comes before a decarbonization plan
A reduction target only means something against a reliable starting point.
Investors, auditors and global customers increasingly want emissions figures they can rely on. For a logistics provider's customers, transport emissions count toward their own value chain total (Scope 3), so they expect their logistics partners to supply the figures for their shipments. Providers that can report emissions by customer, against a documented baseline, become easier to buy from.
For logistics groups, building that baseline is harder than it looks. Freight emissions span four modes and many partners, and smaller sources, such as gas escaping from cooling systems and safety equipment, are easy to miss. Building on the GHG Protocol, the basis for climate disclosure rules such as California's and the International Sustainability Standards Board (ISSB) standards, turns a one-off estimate into a baseline the business can defend and track year after year.
Frequently asked questions
What is an audit-ready emissions baseline?
It is a company's measured greenhouse gas emissions for a reference year, broken down by source and by scope, with the data, emission factors and calculations documented so an auditor can trace every figure. Reduction targets and progress are measured against it.
Why measure leaks from HVAC systems, circuit breakers and fire extinguishers?
These assets hold gases that can escape over time, and some of those gases trap far more heat than carbon dioxide. Under the Greenhouse Gas (GHG) Protocol, these leaks count as a company's own direct emissions, so leaving them out understates the baseline.
What are customer-level emissions in logistics, and how does GovEVA calculate them?
They are the share of a logistics provider's emissions that comes from one customer's shipments. In this engagement, integrations bring ocean, air, road and rail freight data into the platform automatically, emissions are calculated with factors aligned with the GHG Protocol, and the results are allocated to each customer with no manual entry.
Build emissions data your customers, investors and auditors can rely on
Talk to GovEVA about audit-ready, customer-level emissions reporting for your logistics business.
Book a demo